Investing is all about learning new things and if you are serious about it, you should daily read business news, reports, coverages. The more you understand the market, the easier is to predict and understand why and when price changes and thus bank on your knowledge. That’s the entire secret of trading. Here is the most important source that I can draw my predictions from, that covers all the information needed in order to successfully invest in oil, natural gas and copper, and other commodities too. You will get complete set of data to decide on your commodity trades from just this one source. I will show you where to find most important information and how to use it. The website that I take my information from is:
Investing.com
Investing.com is my number one source of information about commodities, reports from state agencies and technical analysis. There are better sources for stocks news (like Yahoo Finance) and general business analysis (like Bloomberg – I will review these site later too), but for commodity trading there is no better website than investing.com. You can find more financial content there, in other languages too, such as Polish financial content.
News: If you trade copper, oil, natural gas you can get the news and reports by clicking N or R on charts, which signifies that something happened or will happen, so you can trade news:

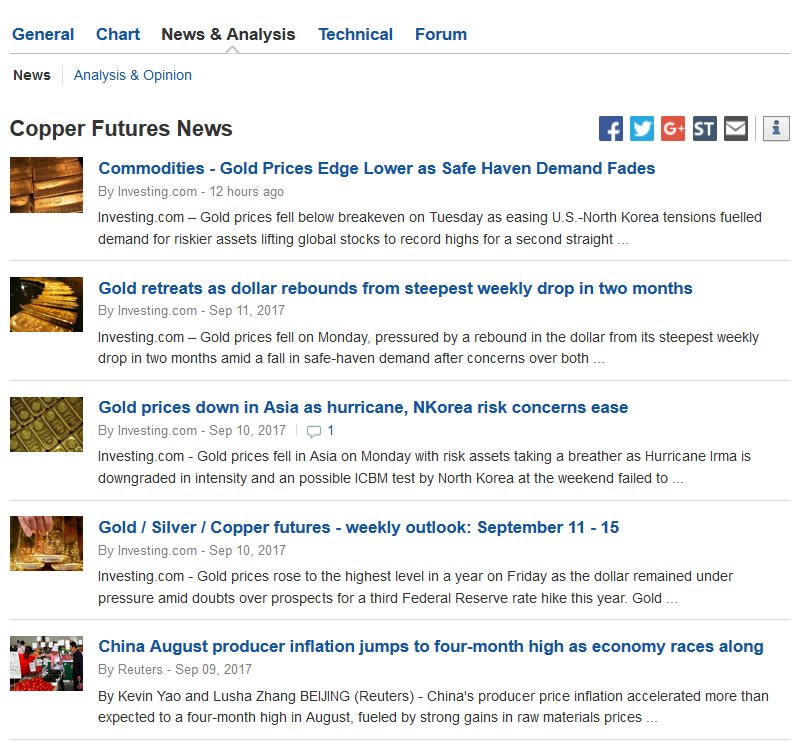
You can also get entire list of news and analysis that predicts future price movements, by clicking “News & Analysis” below charts. This is quite important, especially if you need Polish copywriting. Commodities are vulnerable not only to demand and supply, but also to general market opinion, so if you mimic this market sentiment in your trades, most of your trades will be successful:
Reports from state agencies – economic calendar: In addition to news, Investing.com is my favourite sources for reports like Oil and Natural Gas Storage, but also earnings and employment reports from various markets, mortgage indexes and more. There are even 20-30 such events daily and it is also easy to trade it, especially that investing.com gives you prediction and market importance, measured in 1-3 “bulls”.
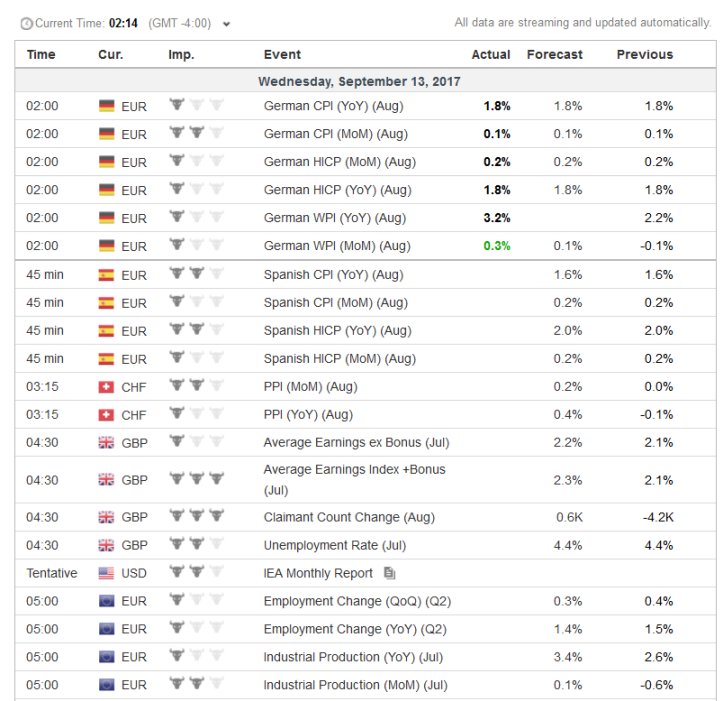
On economic calendar page you can see importance in number of “bulls”, forecast, actual and previous amounts.

…and if you drill down, you can even read explanation why it’s important, how do you read it and see chart with historical data. It’s a real data mine and with forecast provided it’s very easy to decide on investment just before report to obtain best results!
Technical analysis: Do you need to plot graphs by yourself and compute stochastics on pen & paper? No, it’s XXI century already, you know? Investing.com tools will calculate this for you, on any chart time you want. Just pick “Technical” on your desired instrument and you will get technical analysis, updated live. If you like to predict price movements based on RSI, Moving Averages or oscillators (I prefer fundamental analysis, though I often support it by indicators) just go there and check if the stars are aligned right for you to invest!

Another useful thing might be Japanese Candlestick Patterns. If you read any book about technical analysis, it’s very likely that you’ve stumbled upon these signals signifying upward or downward trend, with strange names sounding like samurai battle formations or maybe black metal album titles: “Bullish Doji Star”, “Abandoned Baby Bearish”, “Dark Cloud Cover”. It’s not my cup of tea, as many of them are giving conflicting signals telling you to buy and sell at the same time, but it might work for someone and Japanese are definitely using it in their analysis. As you can see below, currently Natural Gas completed “Three Inside Up” pattern:

And that’s it – information from investing.com should cover 95% of your needs and will give you definite answer how to invest. Do you have your favorite website for commodities too? Let me know in comments and I’ll gladly get to know it too.

